
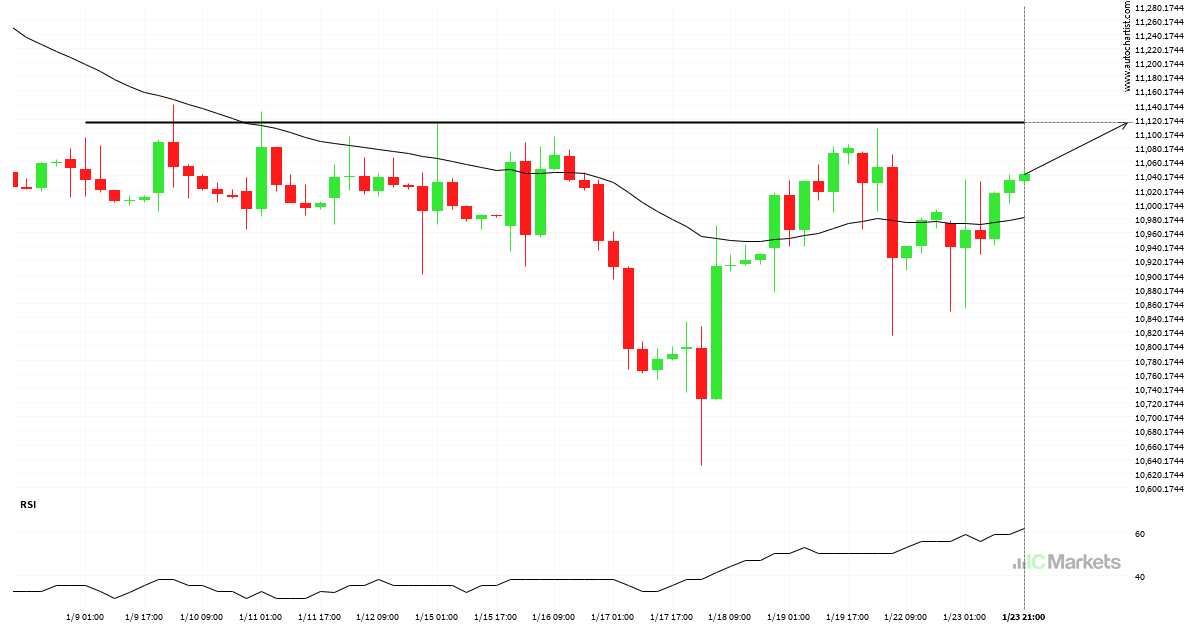
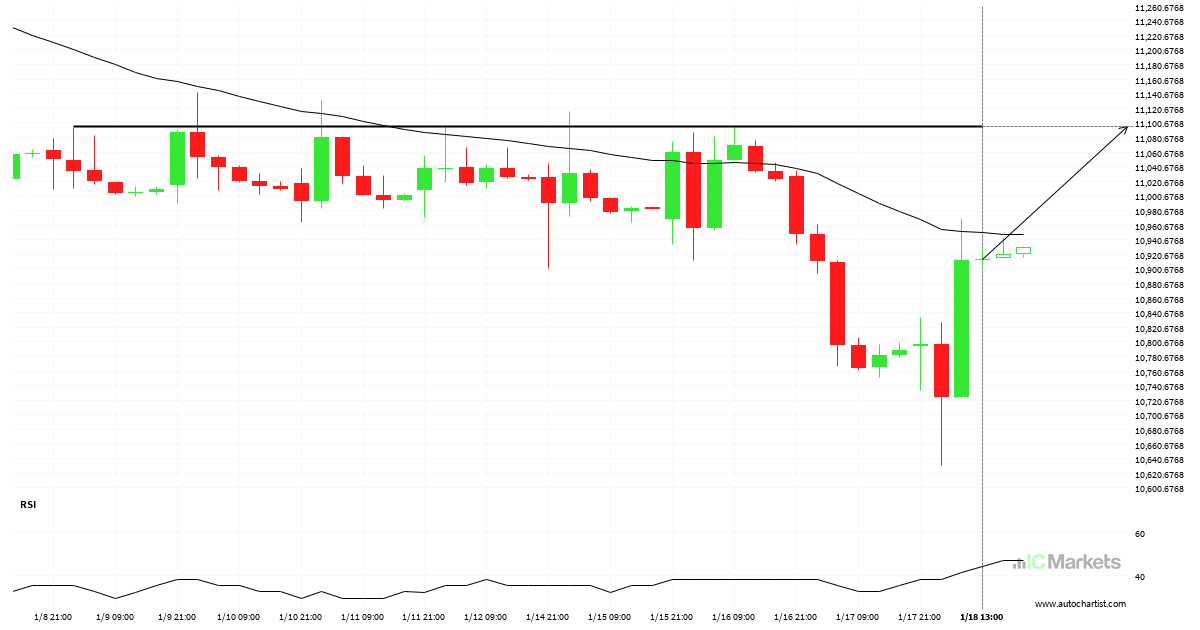
FTSE China A50 Index approaching resistance level
The movement of FTSE China A50 Index towards 11115.5195 price line is yet another test of the line it reached numerous times in the past. We could expect this test to happen in the next 3 days, but it is uncertain whether it will result in a breakout through this line, or simply rebound back […]
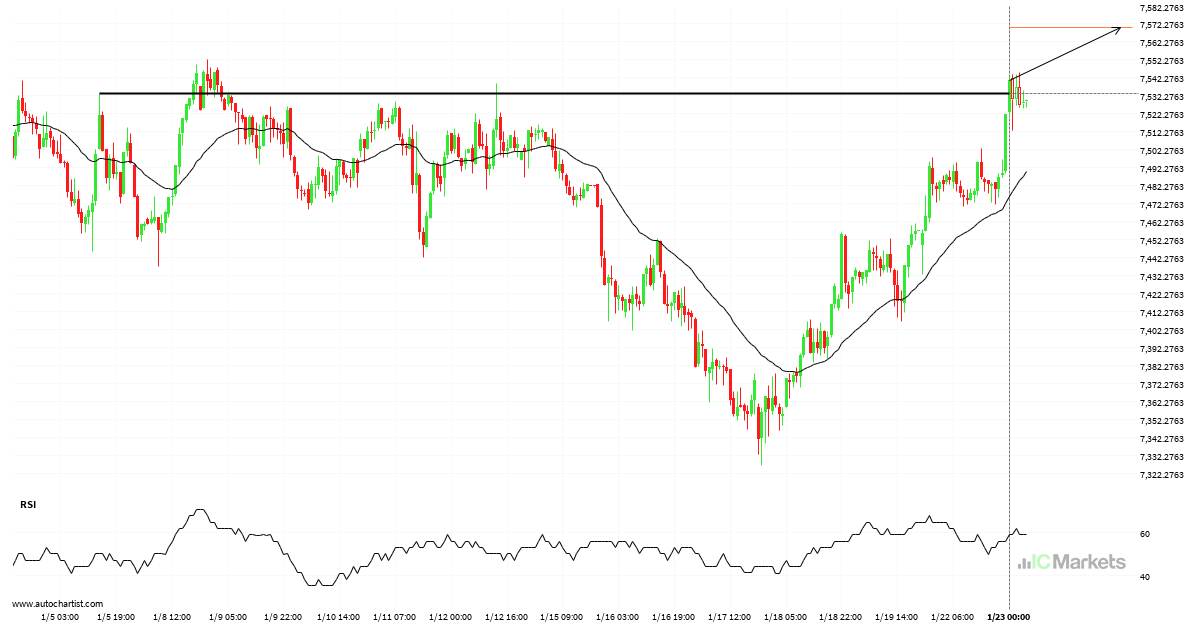
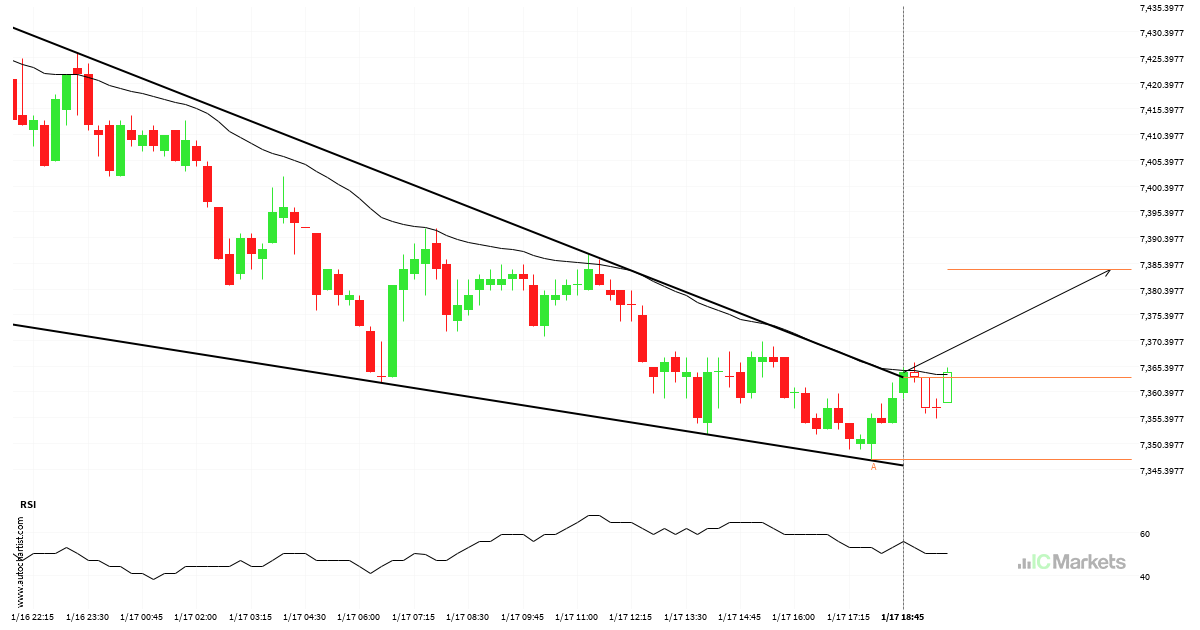
Possible start of a bullish trend as Australia 200 Index breaks resistance
The price of Australia 200 Index in heading in the direction of 7570.1279. Despite the recent breakout through 7533.6899 it is possible that it will struggle to gain momentum to the forecast price and move back in the other direction. This has happened many times in the past so watch for a possible bounce back.
Australia 200 Index approaching resistance level
The price of Australia 200 Index in heading back to the resistance area. It is possible that it will struggle to break through it and move back in the other direction. The price may eventually break through, but typically the price retreats from the level a number of times before doing so.
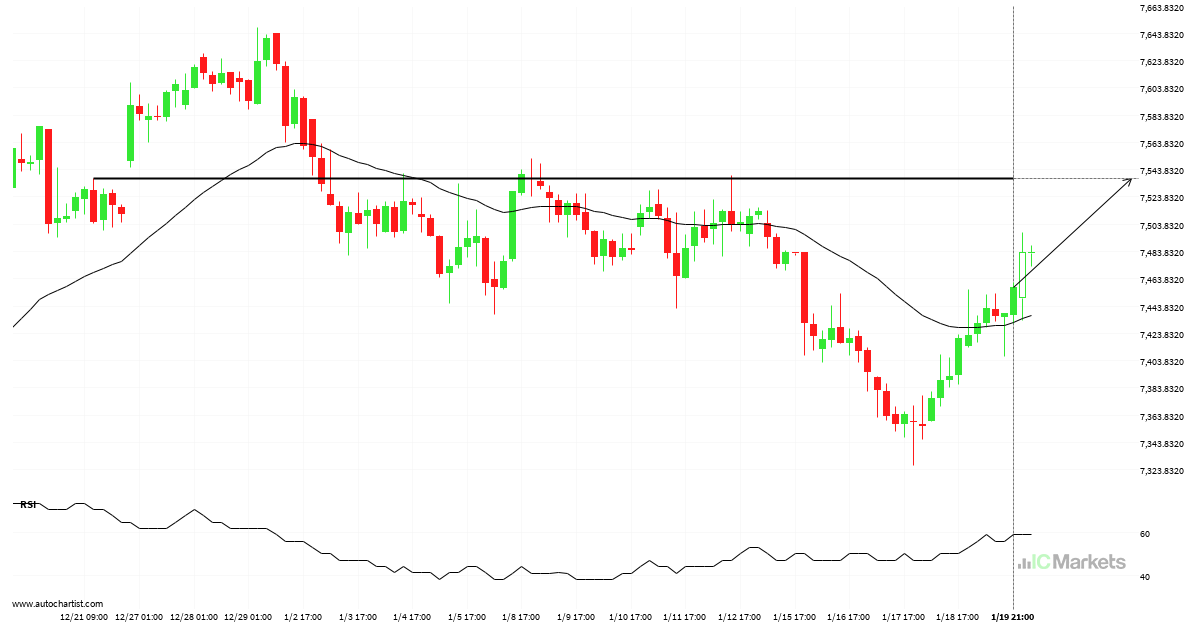
Hong Kong 50 Index has broken through resistance
You would be well advised to confirm the breakout that has just occurred – do you believe the move through resistance to be significant? Do you have confirming indicators that the price momentum will continue? If so, look for a target of 15721.2461 but consider reducing the size of your position as the price gets […]
Australia 200 Index – getting close to psychological price line
The movement of Australia 200 Index towards 7533.6899 price line is yet another test of the line it reached numerous times in the past. We could expect this test to happen in the next 2 days, but it is uncertain whether it will result in a breakout through this line, or simply rebound back to […]
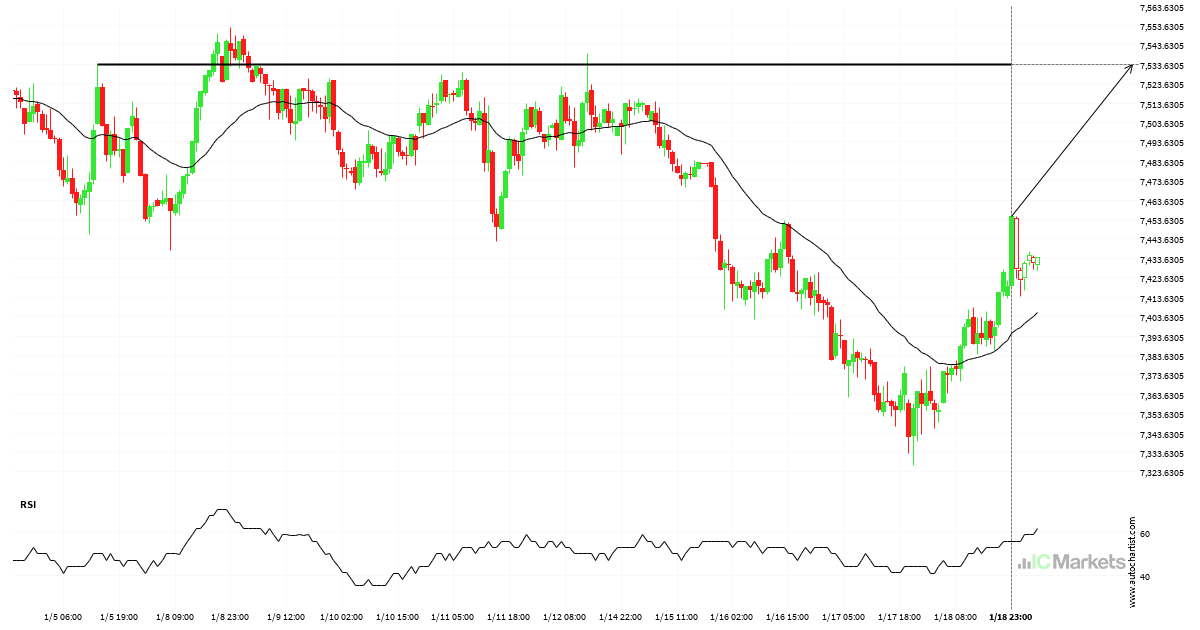
FTSE China A50 Index approaching resistance level
The price of FTSE China A50 Index in heading back to the resistance area. It is possible that it will struggle to break through it and move back in the other direction. The price may eventually break through, but typically the price retreats from the level a number of times before doing so.
Australia 200 Index – resistance line breached
This trade steup on Australia 200 Index is formed by a period of consolidation; a period in which the price primarily moves sideways before choosing a new direction for the longer term. Because of the bullish breakout through resistance, it seems to suggest that we could see the next price move to 7384.2068.

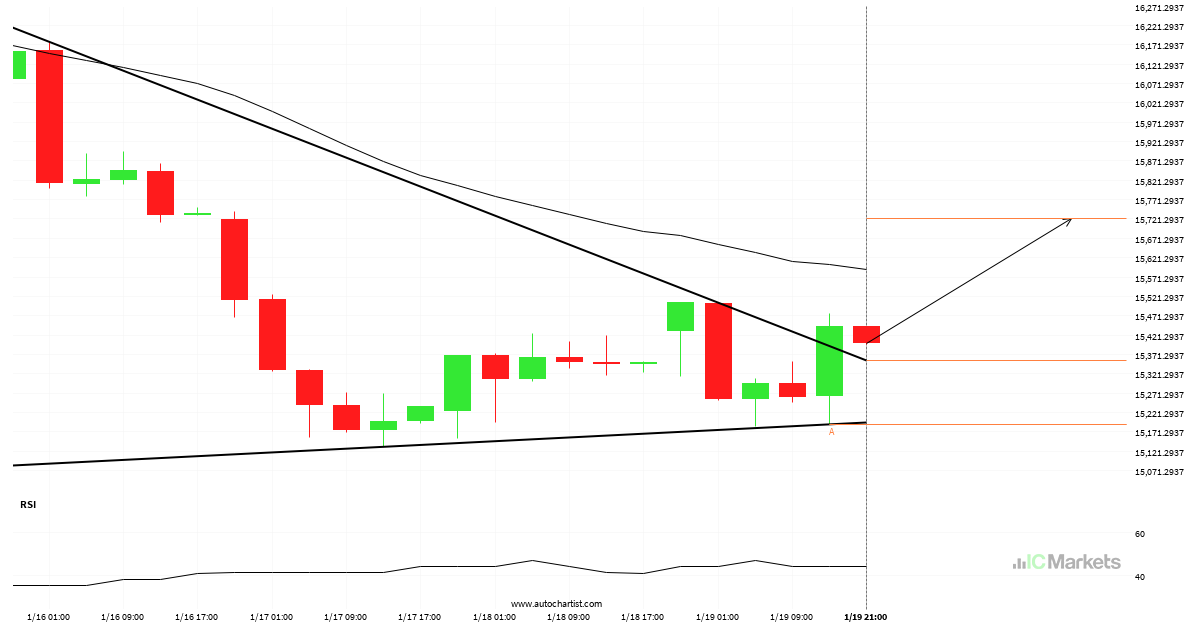
Possible breach of support level by Hong Kong 50 Index
Hong Kong 50 Index is moving towards a support line which it has tested numerous times in the past. We have seen it retrace from this line before, so at this stage it isn’t clear whether it will breach this line or rebound as it did before. If Hong Kong 50 Index continues in its […]
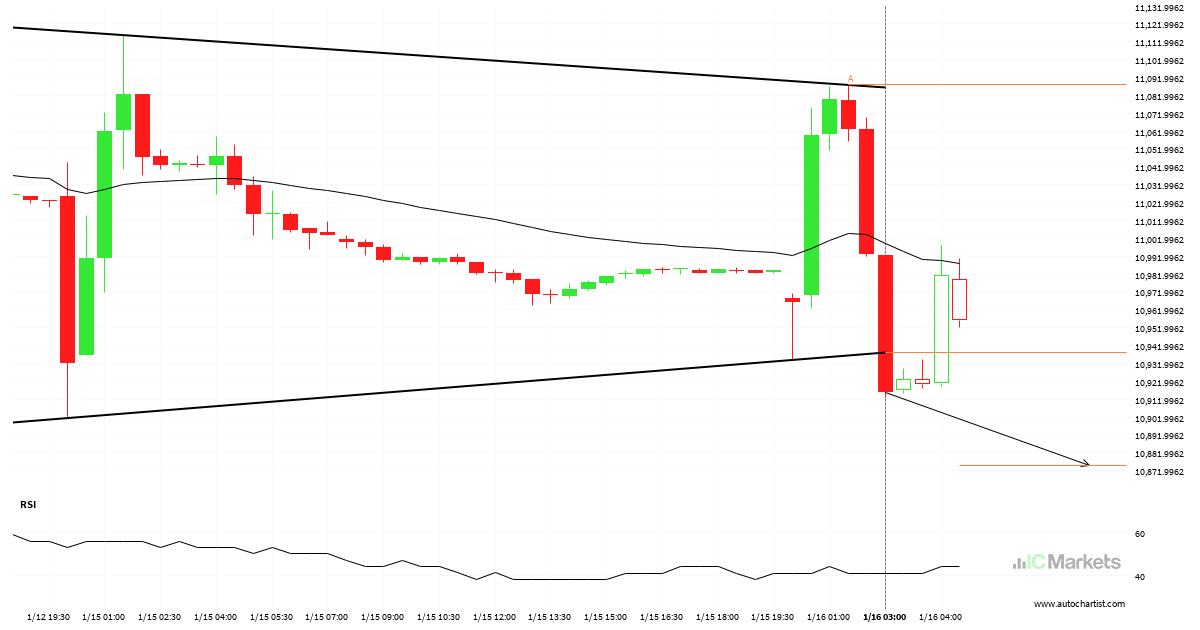
FTSE China A50 Index – support line broken at 2024-01-16T04:30:00.000Z
FTSE China A50 Index has broken through a support line of a Triangle chart pattern. If this breakout holds true, we may see the price of FTSE China A50 Index testing 10875.0683 within the next 5 hours. But don’t be so quick to trade, it has tested this line in the past, so you should […]
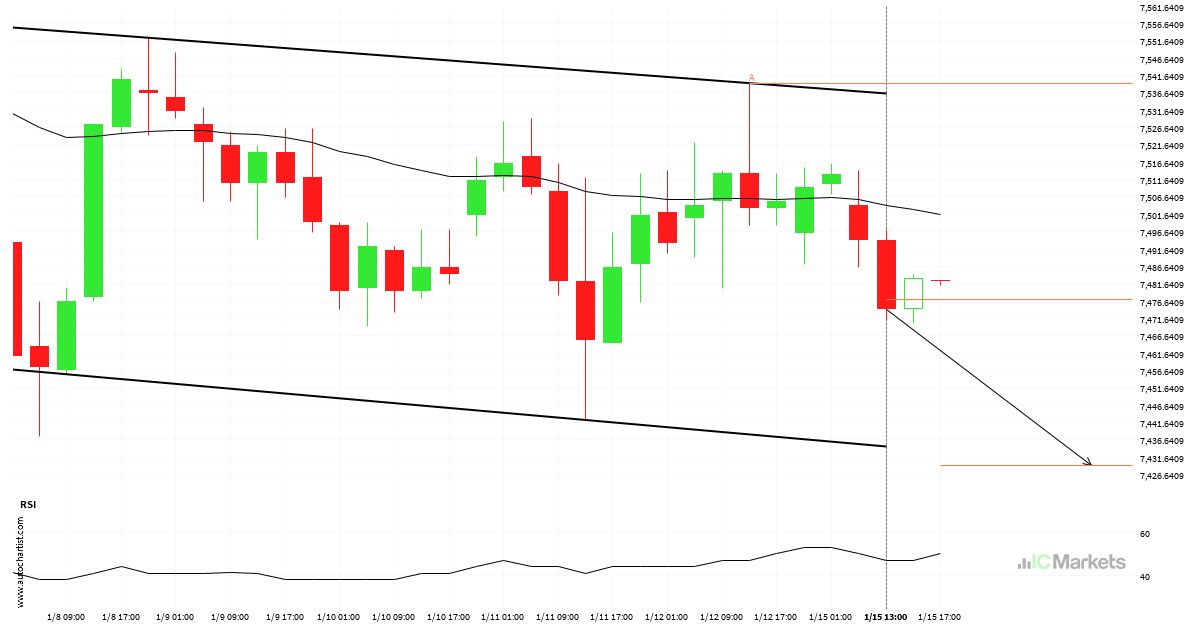
Will Australia 200 Index have enough momentum to break support?
Australia 200 Index is heading towards the support line of a Flag and could reach this point within the next 2 days. It has tested this line numerous times in the past, and this time could be no different from the past, ending in a rebound instead of a breakout. If the breakout doesn’t happen, […]